

In this guide, we share 10 tips to help you improve Excel skills free, so let’s get started.
Key Takeaways
Excel was first introduced by Microsoft in 1985 and was initially used solely for business purposes. However, as time has passed, it has become so common that we use MS Excel in almost every aspect of our lives, whether educational, official, business or even personal.
Even today, it retains its appeal, and its popularity is growing by the day! Excel skills are essential for advancing in any professional field. Read on to learn how to master the 10 ways to improve your Excel skills in 2022.
Developing Excel skills is an effective way to begin analyzing data like a professional. There are numerous compelling reasons to learn Excel!
Whether you're aiming for a future career as a data analyst, want a new skill to use at work, or want to turn your household budget into a well-oiled machine, learning how to analyze data in Excel with Excel formulas and tools will undoubtedly improve your life's efficiency.


Browse Courses on Unmudl Today!
Start with Mechatronics and Robotics Maintenance, designed for warehouse associates and equipment operators. Unmudl's platform connects you to Career Choice funding and training that employers actually want.
Explore Career Choice
Good jobs, in your area.
Unmudl matches you to hands-on training and hiring employers close to home. Sign up to see what's near you.
Good jobs, in your area.
Unmudl matches you to hands-on training and hiring employers close to home. Sign up to see what's near you.
Good jobs, in your area.
Unmudl matches you to hands-on training and hiring employers close to home. Sign up to see what's near you.
Good jobs, in your area.
Unmudl matches you to hands-on training and hiring employers close to home. Sign up to see what's near you.

We help people like you find new careers they love!
Contact us for a free consultation to begin your new career journey.

Top 10 ways to improve Microsoft Excel skills in 2022
Microsoft Excel remains the go-to software for the majority of people looking to do some quick data analysis more than 30 years after its creation.
Sure, there is more powerful, better, and more complex data analysis software available these days, not to mention the free, web-based Google Sheets, but nothing has the broad appeal and powerful simplicity of analyzing data in Excel.
Excel skills can be useful for a wide range of jobs, not just data analysts. Marketing, sales, human resources, accounting, administrative assistants, and the list goes on!
Because numbers rarely lie, making data-driven decisions is critical. Companies require skilled professionals who can transform raw data into actionable insights.
That is why learning how to use Excel is the first step for those interested in getting a career boost. Following are 10 ways to improve your Excel skills in 2022:
1. Master keyboard shortcuts
Excel comes with a slew of keyboard shortcuts to help you work faster and more productively. Two or three keystrokes are used to accomplish significant functions instead of using the mouse to access the toolbar. Isn't that much more convenient and time-saving? Using Excel shortcuts speeds up the process and cuts down on work time.
Related: How to Become an Expert in Microsoft Excel
The answer to the question of whether you need to learn these shortcuts is no. It would, however, be advantageous if you could recall a couple of them. You will be able to remember the majority of the frequent Excel shortcuts with consistent practice.
.webp)
2. Conditional formatting
This is a feature found in Excel and Google Sheets, two prominent spreadsheet tools.
When the data in a cell matches certain requirements, this function automatically applies formatting to that cell, such as font color or bolding. The font color in all cells with negative values, for example, is automatically converted to red in the image.
Follow the instructions below to apply conditional formatting to an Excel workbook.
- Create or open an Excel workbook.
- Select the desired cell range. You may also use Ctrl+A to select the entire workbook.
- Select the Conditional Formatting option on the Home tab, then New Rule.
- Under Select a Rule Type in the New Formatting Rule window, choose the type of rule you wish to create.
- Select the desired Format Style under Edit the Rule Description, and then select or enter the relevant criteria for the Rule Type and Format Style you've chosen.
- To save and apply the rule to the selected cells, click OK.
Unmudl Tip: Note that the Excel web browser version only has a limited number of built-in conditional formatting possibilities. However, conditional formatting rules can be fully customized using the Excel application.
Conditional formatting has been given to the temperature data, displaying the top 10% and bottom 10% values.
3. Macros
Your first step in automating repetitive tasks. Certain things are done on a daily basis, every working day. Wouldn't it be nice if there was some magical way to press a single button and have all of our routine tasks completed?
Excel macros assist you in accomplishing this. A macro is a recording of your routine steps in Excel that you can replay with the click of a single button.
Visual Basic for Applications (VBA)—an object-oriented programming language for Microsoft Office applications—is used to create macros.
The Developer tab contains macros and VBA tools. VBA allows you to refer to Excel Objects and use their properties, methods, and events to automate almost any task.
How to record a Macro:
- First, ensure the Developer Tab has been enabled
- In the Code group on the Developer tab, click Record Macro.
- Optionally, give the macro a name in the Macro name box, a shortcut key in the Shortcut key box, and a description in the Description box before clicking OK to begin recording.
- Perform the actions you want to automate, such as entering boilerplate text or filling down a column of data.
- On the Developer tab, click Stop Recording.
- Congratulations! You have created your first Macro.
Related: What Excel Skills Are Most Valuable for Finance and Accounting?
4. PivotTables
A PivotTable is an Excel feature that allows you to generate reports from large datasets. It's a powerful tool because it allows users to examine the same data from various angles.
PivotTables can be used to calculate, summarise, analyze, and visualize data comparisons, patterns, and trends. This is the key function that counts among the essential excel skills for data analysts.
Related: Get a certificate in one week for only $200 and master Excel Essentials for Data Analysts
They can be used to sort, count, total, or average data stored in a single large spreadsheet and display it in a new table. A PivotTable is a dynamic way to:
- Present large amounts of data and analyze it in a variety of user-friendly ways.
- Sort and summarize data based on categories and subcategories.
- Make your own calculations and formulas to apply to the dataset.
- Filter, sort, and group the data to focus on the information that is important to you.
- Present brief, engaging, and illustrated reports.
For example, on the first image is a plain list of household spending, and the second one is a PivotTable based on the list:
.webp)
.webp)
Forecasting is critical in any type of management, including business and non-profit organizations. Excel pivot tables can help any user construct customized tables from vast data groupings in this assignment.
Furthermore, altering data in this manner will aid in the discovery of repeating patterns in the data. As a result, precise data forecasting will be easier.
Another important benefit of pivot tables is that they can assist any user in quickly and accurately developing or constructing reports and presentations. It will prevent any user from manually creating reports. This frees up a significant amount of time for other tasks and activities.
Related: Excel Data Analyst Ultimate Guide
5. Charts
Charts improve data presentation by giving a simple visualization, which is especially useful when dealing with complex statistics. It enables users to compare portions of a data collection to the rest of the data in the set.
One of the most effective ways to display data analysis is to create charts. Excel has over 20 different chart kinds. The most widely used charts are bar, column, pie, line, and scatter charts.
A single sequence of numbers is required to produce a bar, column, pie, or line chart. You'll need two sets of related data to compare in order to construct a scatter chart, such as height against weight.
The Excel program streamlines the creation of charts using pre-existing data sets. If a spreadsheet already has current data, the chart function can turn that data into a chart with very little user input.
.webp)
The Excel function Recommended Charts is an important aspect of this procedure. Spreadsheet administrators can create a chart in a few clicks using the chart function, selecting a chart type as well as settings such as labels, axes, and titles.
.webp)
Users can use Excel's Chart function to create a balance between automation and customization. Although the application may quickly and easily construct a chart, the user can also assert control over numerous chart details if desired. Users can fine-tune the chart settings to any detail, in addition to changing the data provided inside the chart.
Unmudl Tip: If a company or other entity uses spreadsheet data maintained in Excel, the chart feature in Excel can help with data integration. When an Excel spreadsheet creates a chart from data in a worksheet, for example, the chart will automatically update anytime the data is changed. This enables company managers and administrators to manage their data and visualizations in a single application, with real-time updates.
6. Filters/ AutoFilter
As you gain experience with Excel, you'll undoubtedly want to be able to swiftly study data in a table. Filtering effectively hides information that you aren't interested in.
Typically, you're seeking a specific value, such as 'Blue automobiles,' and Filters will highlight them and conceal the others. However, you may also filter on number values (e.g. is greater than, top 10%, etc.) and even on cell color in more recent versions of Excel.
When you need to filter more than one column at the same time, such as both colors and cars to find your blue car, Excel's filtering tool becomes even more beneficial. The shortcut is Alt D+F+F (easier than it sounds—try it, tapping the keys in order rather than all at once).
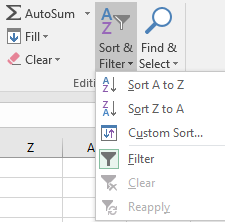
The Filter option in Excel
You can use the Excel AutoFilter tool to narrow down your data based on specified criteria and extract records that match those criteria. To enable a filter, select the cells containing the data you want to filter, then go to the Data tab in the Ribbon and select Filter.
On the column headers, dropdown arrows will appear, providing you the ability to filter the data based on the parameters you're looking for.
You can use the Advanced Filter tool to construct a custom filter in addition to AutoFilter. Advanced Filter allows you to create a one-of-a-kind list of things and move them to a different location in your worksheet or workbook.
7. COUNTIF
COUNTIF is the next Excel function to learn. It counts cells that have specified qualities. For example, you might wish to know how frequently a specific element appears in a list.
COUNTIF will examine the list and count items that meet your criteria. It's one of the most useful Excel functions, and it's easy to master. You'll use it frequently when evaluating data.
As we just explained, in Excel, the COUNTIF function counts the number of cells in a range that match a given condition. For partial matching, logical operators (>,,>,=) and wildcards (*,?) can be used. Criteria can also be based on the value of another cell, as seen in the example below.
Worked Example:
Supposing we have a range of data in cells A1 to A12 with the names of the months January to December
In the next column, from B1 to B12 we have sales for that month
In the final column, from C1 to C12 we have profits (sales - cost)
Here is how you would use the COUNTIF function to see how many times the sales crossed 100 million.
=COUNTIF(B1:B12,">100000000") // count sales over 100,000,000
Here is how you would use the COUNTIF function to count the months you incurred losses.
=COUNTIF(C1:C12,"<=0") // count months when profit was 0 or less
COUNTIF is one of eight Excel functions that divide logical criteria into two halves (range + criteria). As a result, the syntax for creating criteria is different, and COUNTIF requires a cell range rather than an array.
Unmudl Tip: Only one condition is supported by COUNTIF. Use the COUNTIFS function if you need to apply multiple conditions. Use the SUMPRODUCT and/or FILTER functions to alter values in the range argument as part of a logical test.
8. Flash Fill
Because Flash Fill debuted in Microsoft Excel 2013, you're presumably already familiar with it. You might not understand, though, how versatile and effective this tool is. It's an easy approach to add new data or clean up old data.
You could have needed a function or expression in the past to get what you needed. You simply type in the desired pattern and hit Ctrl+E—no stress, no bother.
When using this functionality, there are two requirements:
- The source data must follow a logical pattern.
- After you've updated the source data, you'll need to refresh the Flash Fill results.
Worked Example:
It's easy to use Flash Fill, but you'll need to tell Excel what you want. There are three steps to this process:
- Enter the data from the source.
- Fill up the first cell to the right of the source data with whatever you like.
- Ctrl+E will activate Flash Fill, which will finish the list.
You may need to make two or three entries before Excel recognizes them.
In the image below, C depicts the consequences of typing Susan Harkins into cell D3, Doe into cell D4, and then pressing Ctrl+E. By that point, Flash Fill had finished the pattern and filled in the gaps. Flash Fill not only merged the names, but it also transposed them and added the comma!
.webp)
9. Power Pivots
This is an important Excel function to know since it gives PivotTables (e.g. COUNTROWS) a lot more punch and allows them to handle considerably larger data sets. Power Pivot allows you to link your PivotTables to external databases and refresh them on demand.
For instance, if you had millions of rows of data that Excel couldn't manage, you could save it in an Access or SQL database. You may import this data into Excel using Power Pivot and then create PivotTables and Charts directly from the data.
You may also construct associations between many tables, which is useful if you have certain data in one database and others in another. Combine them with Power Pivot and use PivotTables and Charts to present your findings.
This is one of those Excel talents for a business that is mostly aimed at Excel specialists and business intelligence professionals. If you're serious about data analysis, you'll need to devote some time to learning Excel techniques like Power Pivot.
Related: How to Use Excel for Business
10. Fast Track your Excel skills!
Basic Excel abilities are nearly a prerequisite for almost any career, and higher skills are required for certain jobs such as those above. The best way to improve Microsoft Excel skills in 2022 is to enroll in a quick short course from an accredited community college.
The course mentioned below is only 6 weeks and it will help you build a solid foundation in Excel. Not only that you will end up getting a certificate from a recognized institution that you can use to distinguish yourself in all future job interviews.

Introduction to Microsoft Excel Certificate from PIMA Community College
This is an entry-level certificate course that can be useful for any job in any industry. Even if you are merely an office assistant, knowing MS Excel at a basic level might help you thrive in your career.
Course Description: Create worksheets to assist you in managing, storing, organizing, and analyzing data. The most often used program for this is Excel, Microsoft's powerful spreadsheet software. Most firms, in fact, demand that new hires have a basic comprehension of Microsoft Excel.
This course will teach you the fundamental operations and applications of Microsoft Excel 2019 in 2019. Through hands-on courses, you will discover a variety of shortcuts for quickly and efficiently setting up worksheets.
You'll also discover how to use the function wizard to calculate statistics, future values, and more. You'll also learn how to filter and analyze data, construct three-dimensional workbooks and use macros and buttons to automate frequently-repeated operations.
Course Fee: $218.75Total Price (Excluding Tax)
Work activities you can put on your resume after the course:
- Collect personal or financial information from customers or applicants
- Keep track of financial data
- Calculate financial information
- Make a tax calculation
- Check the accuracy of any financial or transactional data
- Compile information or documentation
Final Thoughts
Data and Excel sheets are inseparable. No matter if you've worked in any industry, I'm sure you've had to open that spreadsheet and work on it at least once.
Excel sheets are an essential element of any organization nowadays, whether you're a manager or a leader who has a lot of reports and data to keep track of or an employee who has to fill them out.
In this article, we showed you 10 tips that showed you how to improve Excel performance in 2022 and we hope that they will come in handy.
Learn In Demand Skills Employers Are Hiring For
Explore our career-ready "Mechatronics and Robotics Maintenance" designed with employers to help you get hired faster. Train for industrial maintenance in ~10–12 weeks, earn a certificate and get ready to interview for technician roles.

Last updated on:
March 6, 2024

_converted.webp)
